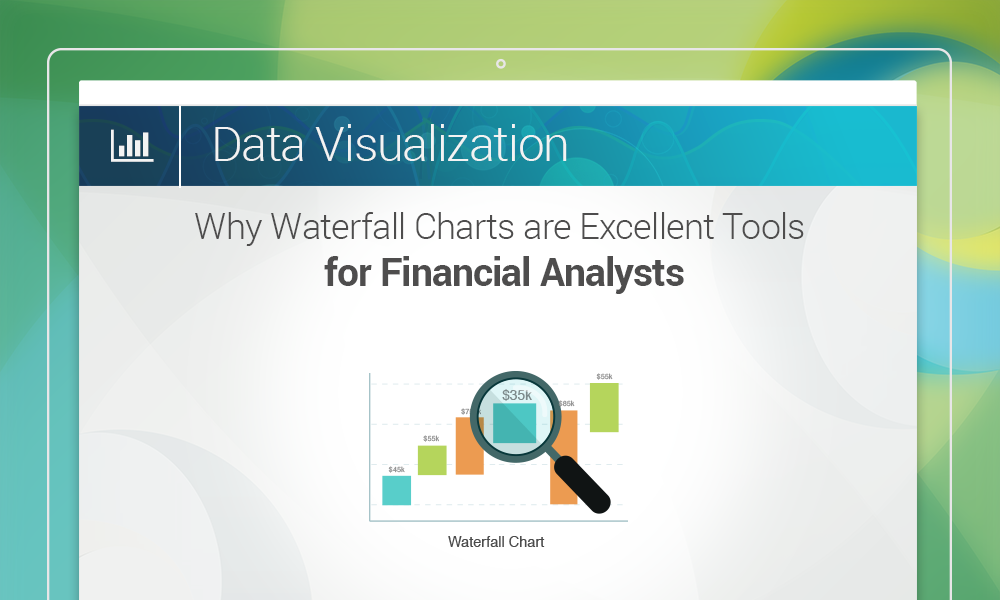
What are waterfall charts? Simply put – a waterfall chart is a diagram that is designed to represent cumulative values of a series of data in a sequential manner. This can be effective in various situations, including conducting a financial analysis. How waterfall charts can help a financial analyst If an analyst wants to […]
Tag: Waterfall Charts
Why Waterfall Charts are Excellent Tools for Financial Analysts