Have you checked out our earlier post on how we have established a technology partnership with Infowise earlier this year? Then you already know how this empowers both Infowise and us to serve customers better than ever before. However, if you have not tried out Collabion DataParts yet, then it might be a good idea […]
Category: Sharepoint Charts
Collabion and Infowise Presented an Outstanding Webinar

How to Get the Most out of Business Data with a Line Chart
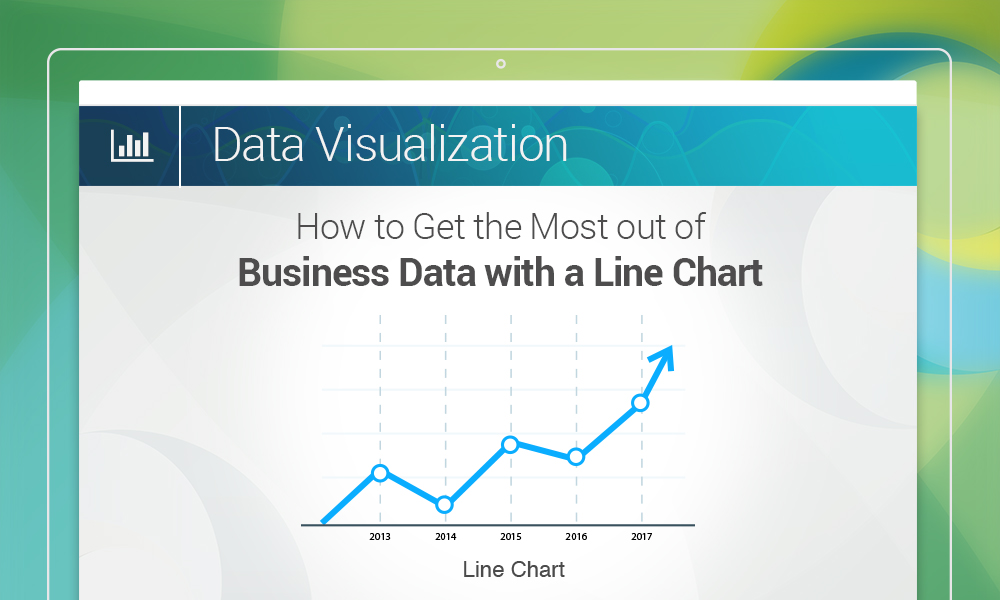
The roots of the line chart, often also referred to as the line graph, can be traced as far back as the 10th or 11th century, making it the oldest type of chart ever made. Humankind has come a long way in making way more complex charts since then. However, the humble line chart […]
Why Waterfall Charts are Excellent Tools for Financial Analysts
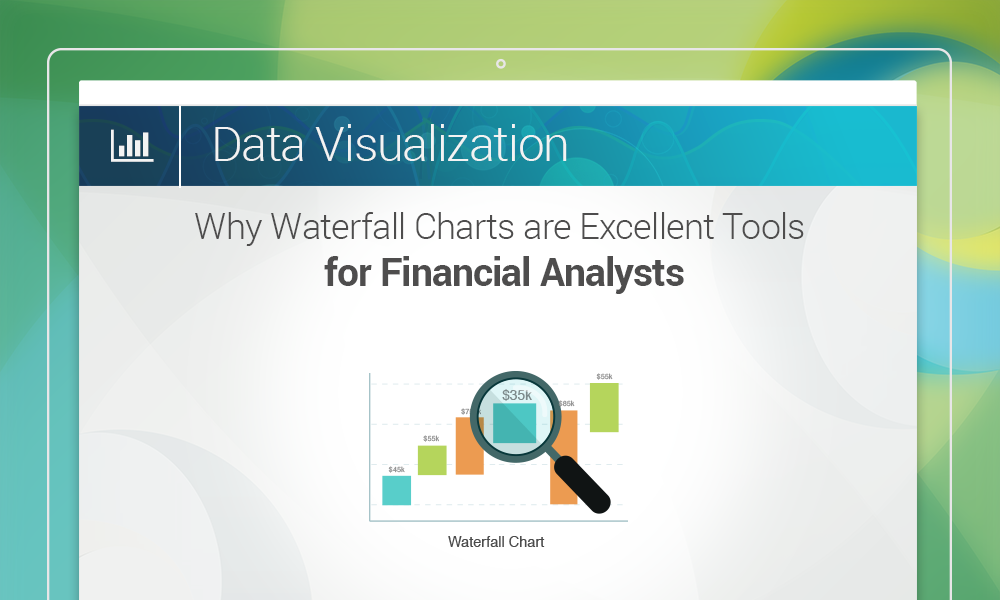
What are waterfall charts? Simply put – a waterfall chart is a diagram that is designed to represent cumulative values of a series of data in a sequential manner. This can be effective in various situations, including conducting a financial analysis. How waterfall charts can help a financial analyst If an analyst wants to […]
3 Ways a Marimekko Chart Provides a New Dimension to Marketing Analysis
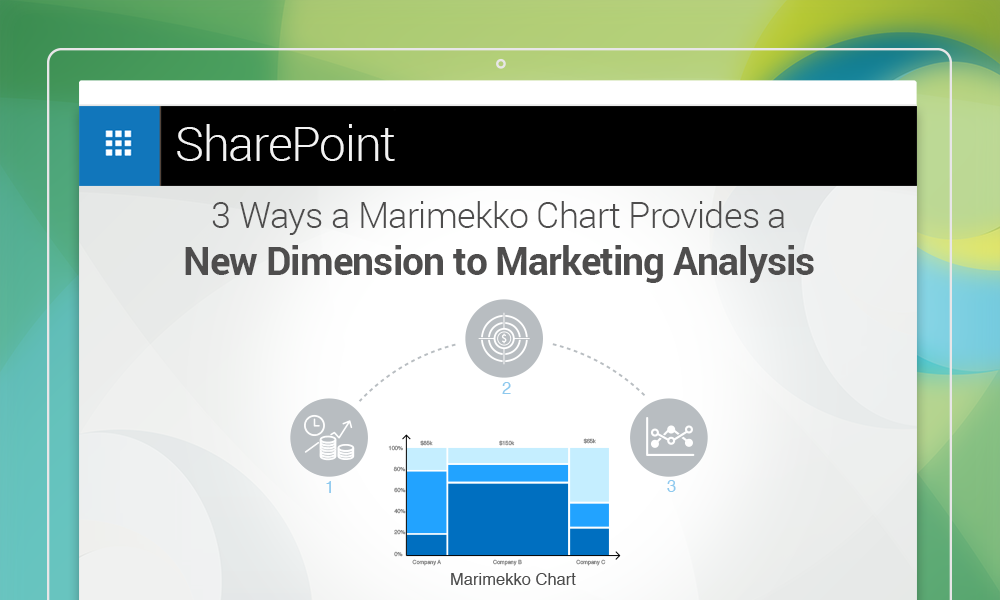
What is a Marimekko (or, as it is often referred to, mekko) chart? As far as a textbook definition is concerned, it is a two-dimensional stacked chart, in which the heights of the individual segments and the widths of the columns can all be variable. Also, the widths of individual columns are scaled, so that, […]
Collabion Charts for SharePoint – Now Available in 2 Powerful Versions
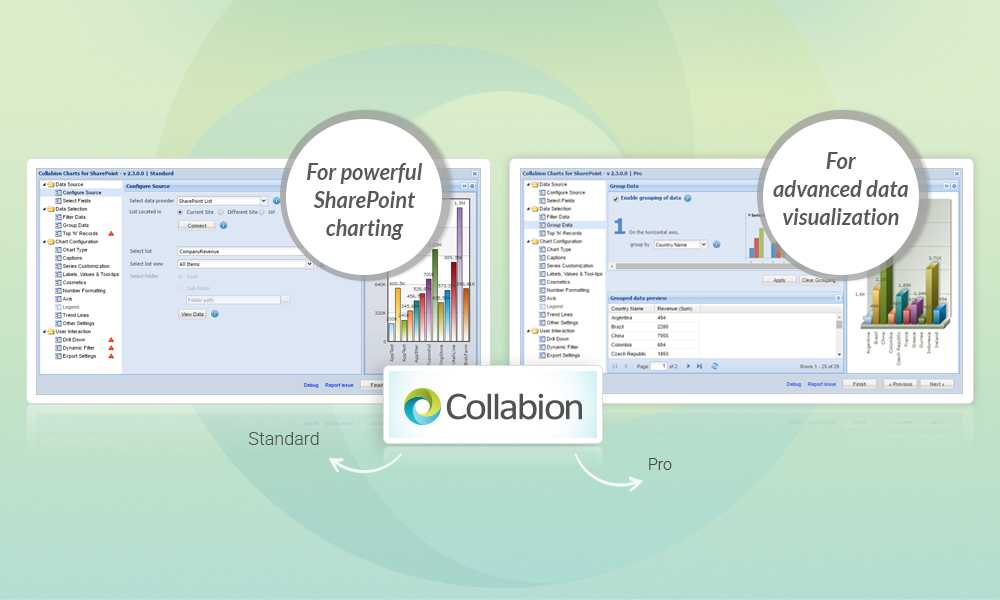
Tired of grappling with business data stored in various locations whenever you need to make charts in SharePoint before presentations? Then this is the best time to check out Collabion Charts for SharePoint. The recently launched latest version (2.3.0.0) of this popular enterprise charting solution is available in two powerful modes, one available for free […]
Navigating the data jungle: Collabion Charts for SharePoint helps you build charts with just about any data source

Data management with Microsoft SharePoint can pretty much seem like a nightmare in many leading MNCs, given the major diversities in the use of data storage software that can exist across different levels. That is why an enterprise charting solution that can connect to any of those platforms can be very helpful to data analysts […]