SharePoint Graphs from Collabion
Collabion Charts for SharePoint (CCSP) helps you build charts and graphs in Microsoft SharePoint
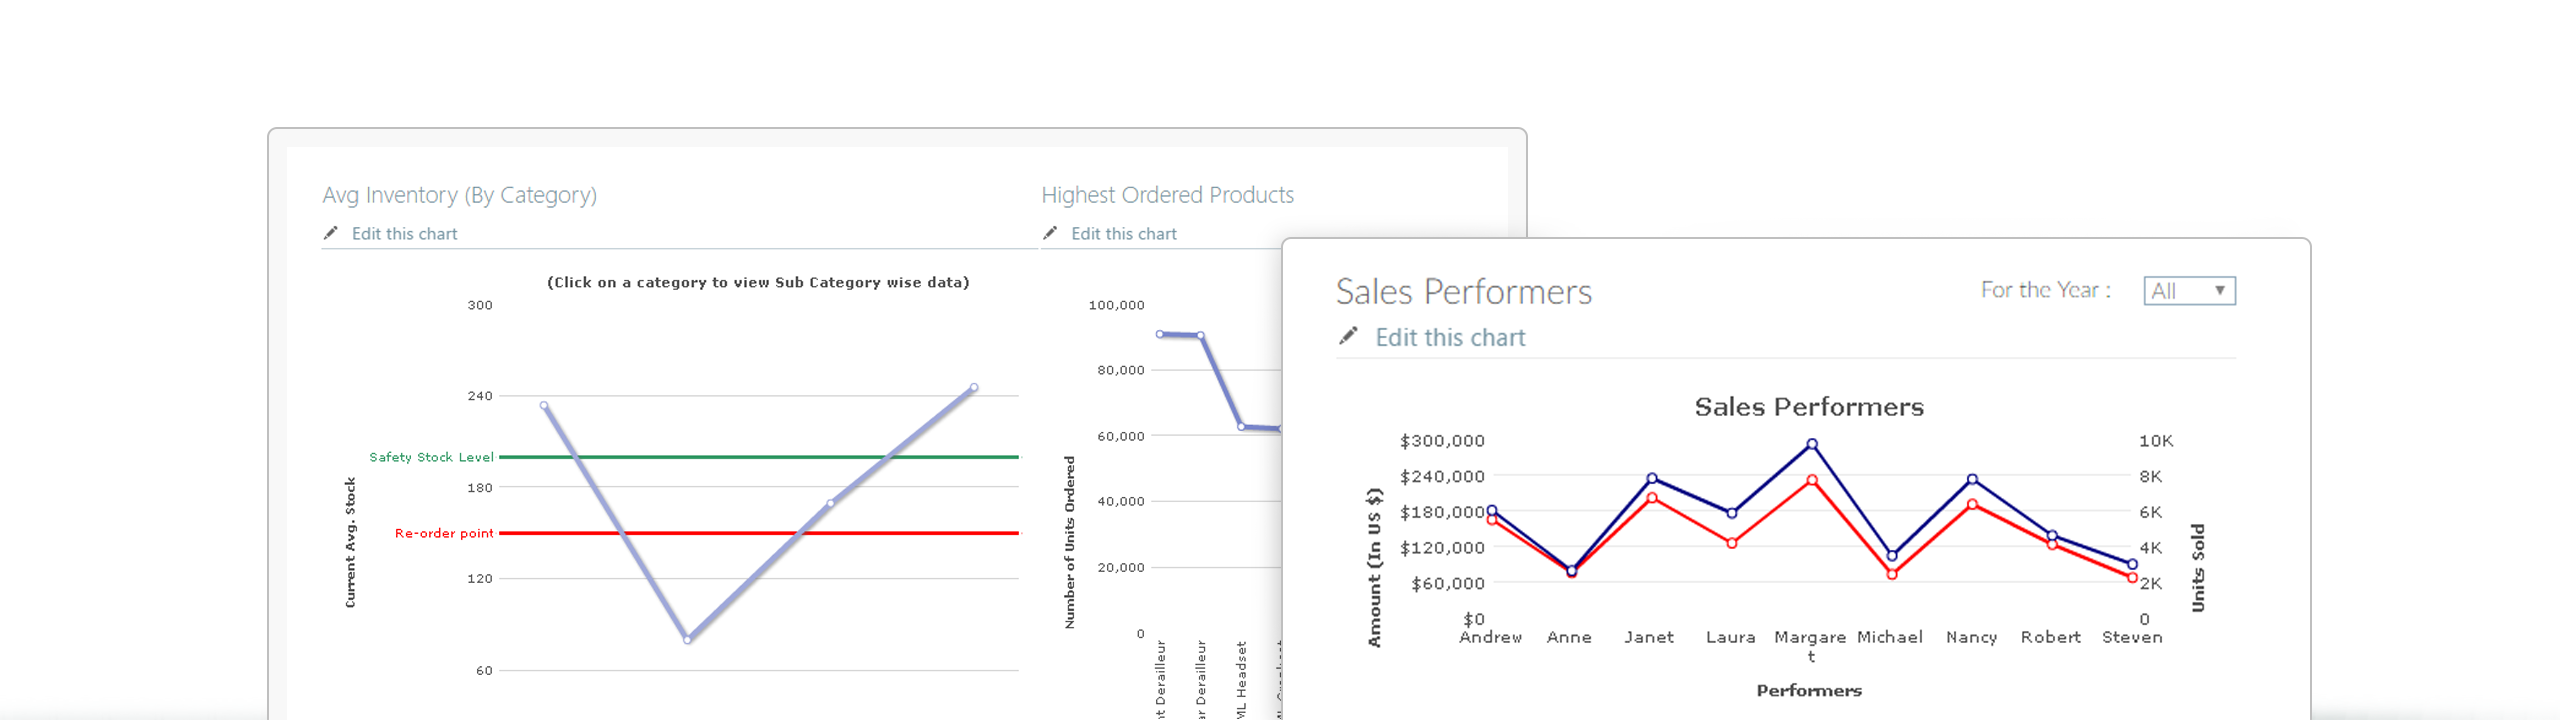
Collabion Charts for SharePoint (CCSP) is a wizard-based, 100% code-less SharePoint chart web part that lets you put together beautiful, interactive charts, and also lets you analyze data to extract insights.
Features of Collabion Charts for SharePoint
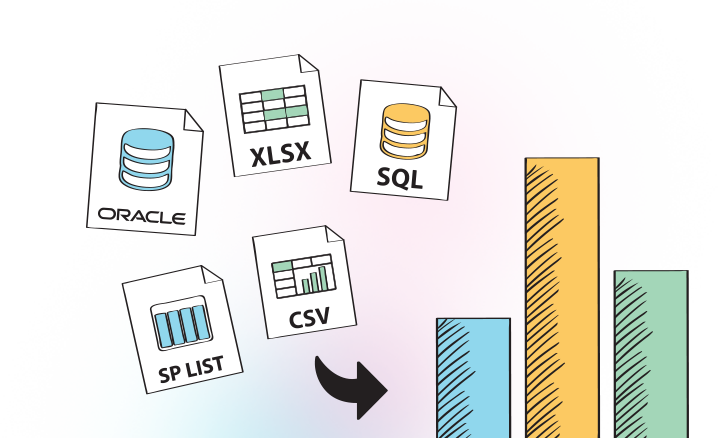
Multiple data sources
With CCSP, you can pull data from various data sources such as SharePoint lists, MS SQL Server, Oracle DB, MS Excel, CSV files/strings, BDC, or ODBC. You get to enjoy seamless compatibility, with the same ease of use, across the board.
Dozens of chart types
Display your business data with the chart type that best represents it. Choose from 56 different chart types, including the ubiquitous line, bar, and pie, as well as specialized types like bubble, Pareto and Marimekko, plus a whole lot more.

Advanced data processing
Utilize advanced data analysis methods, like custom filtering, drill down, and grouping, to extract maximum insights from your business data. With CCSP, you can break down your data a little bit more with every step, until only what you need remains.

Multi-level drill down
With our unique feature, multi-level drill down, you can explore your hierarchical data right up to the 'n'-th level for focused analysis. With the latest version, you can also change chart types with every step, so that you can always visualize the data in the best possible way.

onnectivity with web parts
You can connect a chart to SharePoint OOB Filter web part, SharePoint list, or custom web parts, and pass single or multiple values to the chart. You can also filter the chart data based on a value, or show a subset of the data in the chart.

Seamless compatibility
You can use Collabion Charts with SharePoint 2010, 2013 and 2016, including Foundation servers. There's no need to make any specific settings. Everything just works.