SharePoint Dashboards with Collabion
Get the big picture about your business data at one glance from insightful dashboards built with Collabion
Collabion DataParts for SharePoint is an enterprise level solution for building beautiful charts and interactive dashboards, designed to work exclusively with Microsoft SharePoint.
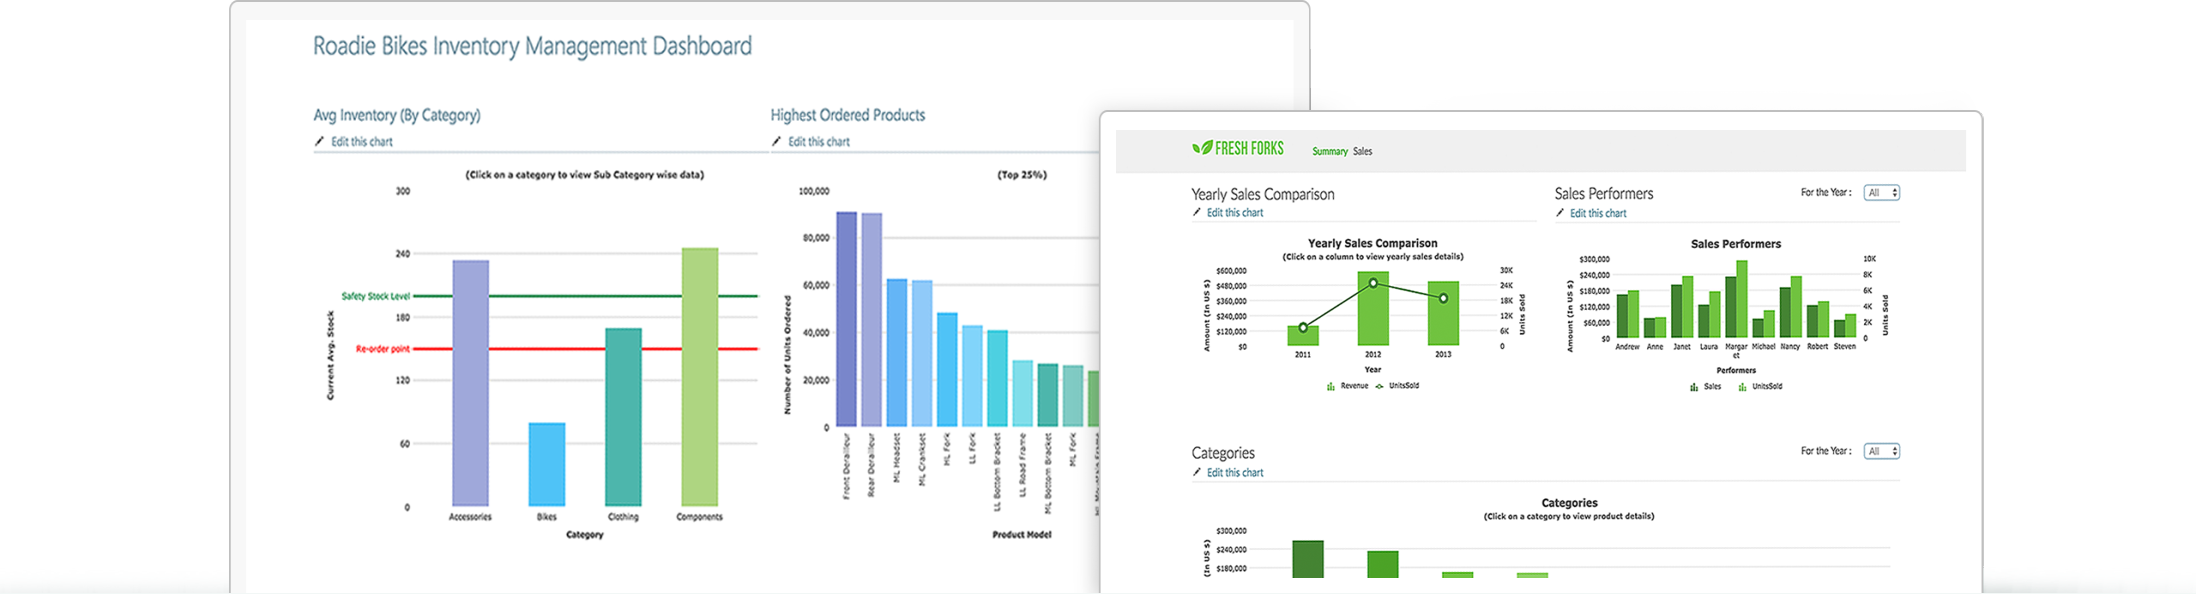
You can use Collabion DataParts for SharePoint to put multiple charts built with your business data side by side within a single, integrated dashboard. This will help you to quickly spot trends, patterns and exceptions in data, and extract actionable insights from it too.
Use the following powerful features of Collabion DataParts to build interactive dashboards that help you visualize your business data better.
Features of Collabion's SharePoint Dashboards
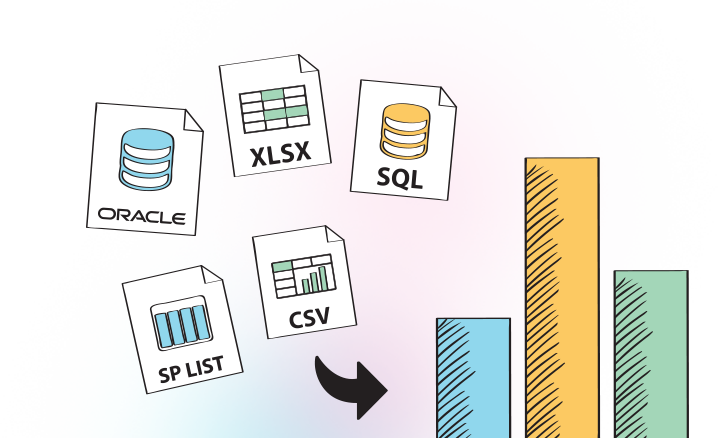
Support for multiple data sources
Collabion supports multiple data sources like SharePoint Lists, MS SQL Server Database, Oracle Database, MS Excel, CSV and many more - so whichever way you store your data, CCSP will be able to make charts out of it!
Web part connections
You can connect a chart to SharePoint OOB Filter web part, SharePoint list, or custom web parts, and pass single or multiple values to the chart. You can filter the chart data based on a value, or show a subset of the data in the chart.

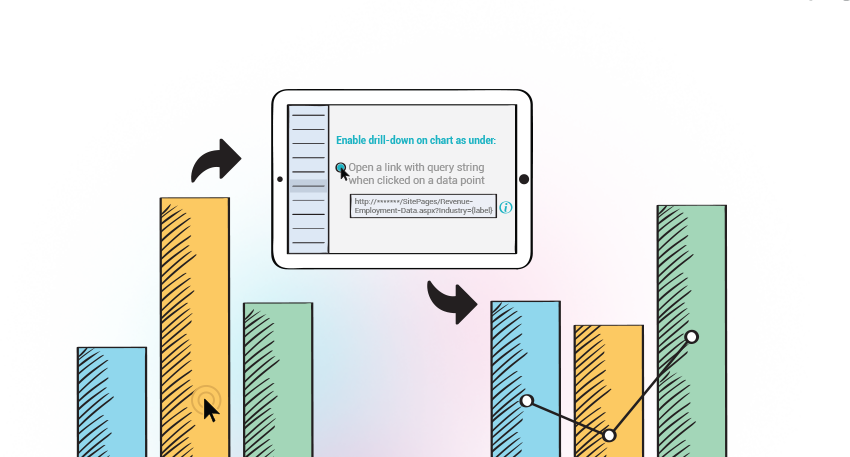
Open a link with query string
With this smart drill-down feature, you can open a web page and pass certain parameters with the URL (query string) when you click on a data point in your chart. You have the option of using pre-defined macros to pass the query string parameters. You can even use this to connect your charts, whether on the same page or otherwise.
Multi-level drill down
You can explore hierarchical data right up to the 'n'-th level with our unique feature, multi-level drill down, for focused analysis. You can also change chart types with every step, so that you can always visualize the data in the best possible way.

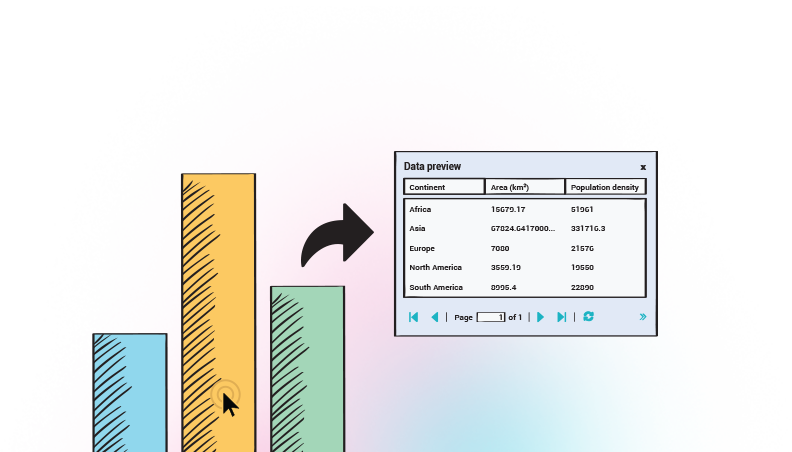
Data View
You can use this smart drill down feature to display the underlying data of a chart, when you click on one of the segments of the chart. The data is displayed in the form of a table that pops up over the chart, which can help you take a quick look at the data without opening the wizard.