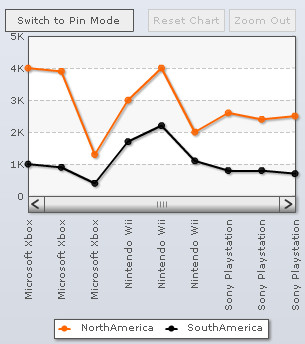
The Zoom Line chart is a special type of multi-series line chart that allows analysis of data at both macroscopic and microscopic levels. It is meant for plotting large quantities of data, which if plotted on an ordinary line chart would produce almost unreadable results. The zoom line chart can easily plot tens of thousands of data points within a single chart.
Learn how to:
- Configure Linear and Logarithmic Axis
- Use dynamic Axis limits
- Customize chart configurations
- Customize chart cosmetics
- Configure Zoom panel
- Configure Pin panel
- Configure Scroll bar
- Specify titles of the buttons
- Specify labels for the context menu items
- Configure advanced settings
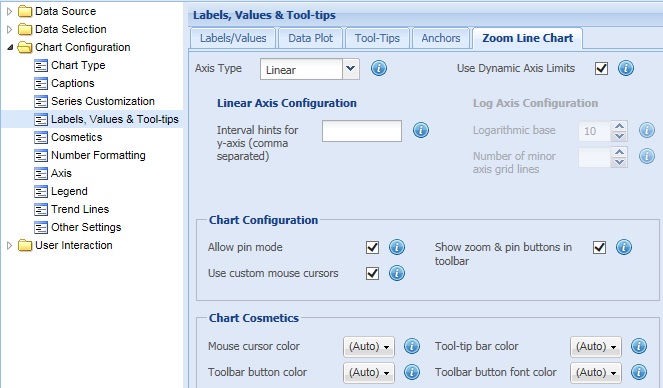
Configure Linear and Logarithmic Axis
In zoom line charts, two types of axes can be displayed. They are:
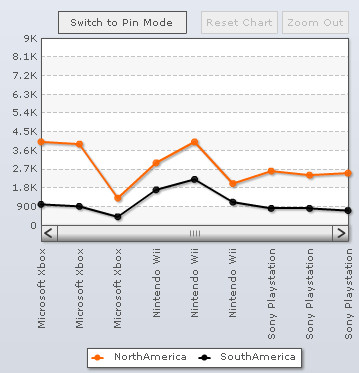
- Linear Axis: In Linear type, the data is plotted at equal intervals.
- Logarithmic Axis: In Logarithmic axis, the data is plotted based on a log or exponential scale.
To configure the linear axis you can:
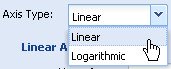
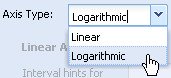
- Select the Linear option from the Axis Type drop-down list. By default, the chart displays linear axis.
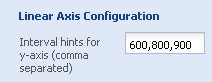
- Enter list of values separated by commas in the Interval hints for Y-Axis (comma separated) to provide the chart a list of possible Y-Axis intervals. The chart chooses the best possible interval from the given list.
- Click Preview to view the changes.
The above configuration results in:
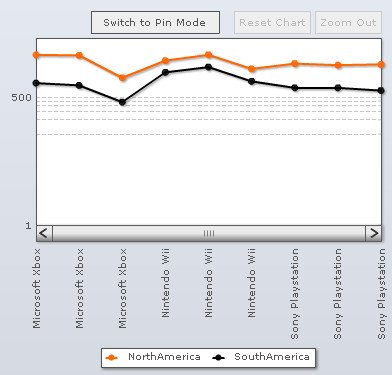
To configure the logarithmic axis you can:
- Select the Logarithmic option from the Axis Type drop-down list.
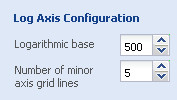
- Select or enter a value in the Logarithmic base box to specify the logarithmic base.
- Select or enter a value in the Number of minor axis grid lines box to set the number of minor divisional lines.
- Click Preview to view the changes.
The above configuration results in:
Note:
Click Apply to apply the changes made.
Click Revert to undo the changes.
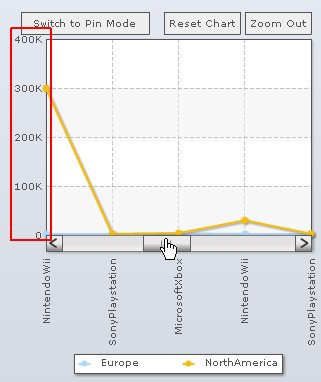
To let the chart automatically decide the Y-Axis limits while scrolling, select the Use Dynamic Axis Limits check box. Click Preview to view the change made. By default, the check box remains selected.
![]()
The charts below illustrate how the scale adapts to the data upon zooming.
Note:
Click Apply to apply the change made.
Click Revert to undo the change.
Customize chart configurations
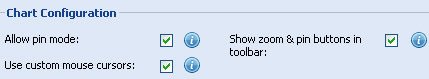
To customize the chart configurations you can:
- Select the Allow pin mode check box to enable the pin mode. By default, the check box is selected.
- Select the Use custom mouse cursors check box to display custom cursors. By default, the check box is selected.
- Select Show the zoom and pin buttons check box to show a toolbar with zoom and pin mode related buttons. By default, the check box is selected.
- Click Preview to view the changes made.
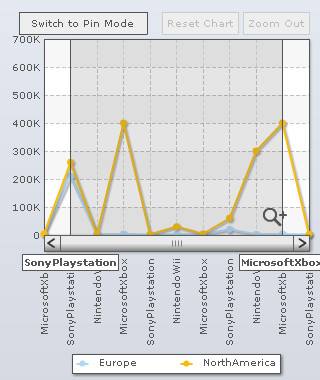
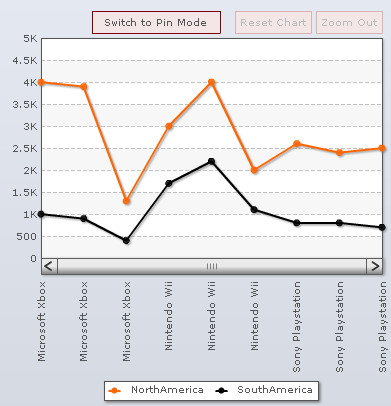
Pin mode allows you to select and replicate a section from the chart and then drag the selection or the pin panel to compare it with the other sections of the chart.
To disable pin mode, clear the Allow pin mode check box.
To use system mouse cursors, clear the Use custom mouse cursors check box.
To hide the toolbar with zoom and pin mode related buttons clear Show the zoom and pin buttons.
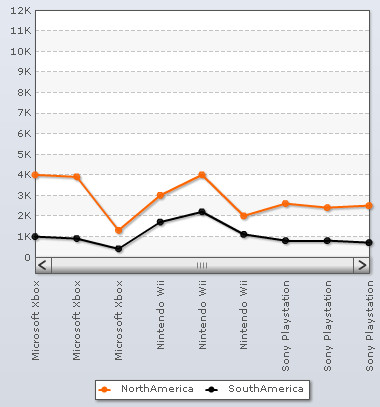
A Zoom Line Chart with the above settings looks as under:
A Zoom Line Chart without the above settings looks as under:
Note:
Click Apply to apply the changes made.
Click Revert to undo the changes.
To customize the chart cosmetics you can:
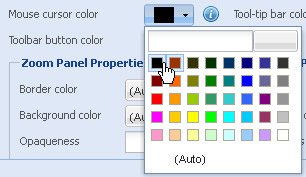
- Change the color of the custom mouse cursor from the Mouse cursor color drop-down color picker. Select (Auto) to let the chart decide the color automatically.
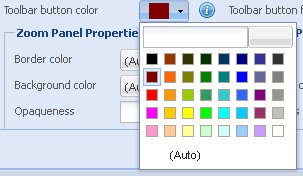
- Change the color for the buttons in the zoom and pin toolbar form the Toolbar button color drop-down color picker. Select (Auto) to let the chart decide the color automatically.
- Change the tool-tip bar color from the Tool-tip bar color drop-down color. Select (Auto) to let the chart decide the color automatically.
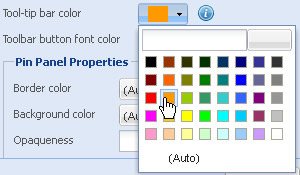
Tool-tip bar is a vertical line shown on the chart area along with tool-tips.
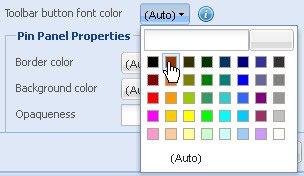
- Change the text color of the zoom and pin toolbar buttons from the Toolbar button font color drop-down color picker. Select (Auto) to let the chart decide the color automatically.
A chart with the above configurations looks as under:
Note:
Click Apply to apply the changes made.
Click Revert to undo the changes.
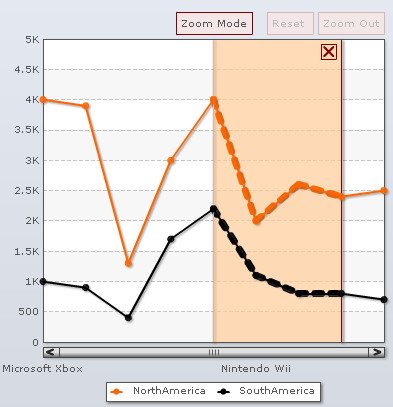
Zoom panel is a rectangular area that appears while selecting a part of the chart data (for zooming) by the mouse cursor.
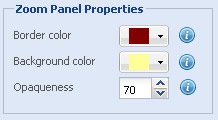
To customize the zoom panel you can:
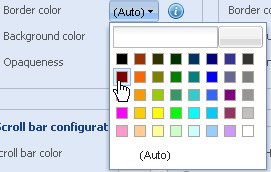
- Change the border color of the zoom panel from the Border color drop-down color picker. Select (Auto) to let the chart decide the color automatically.
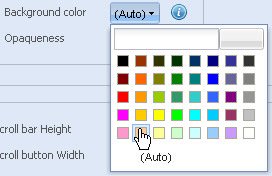
- Change the background color of the zoom panel from the Background color drop-down color picker. Select (Auto) to let the chart decide the color automatically.
- Set the opaqueness of the zoom panel by selecting or entering a value between 0-100 in the Opaqueness box.
The lowest value 0 will make the grid lines completely transparent and invisible; and the highest value 100 will make them completely opaque.
- Click Preview to view the changes made.
A chart with the above configurations looks as under:
Note:
Click Apply to apply the changes made.
Click Revert to undo the changes.
Pin panel is a rectangular panel over the chart containing a portion of the chart replicated in it. The pin panel is drag-able and is used to compare the data in the pin panel with other sections of the chart.
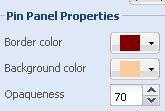
To configure the pin panel you can:
- Change the border color of the pin panel from the Border color drop-down color picker. Select (Auto) to let the chart decide the color automatically.
- Change the background color of the pin panel from the Background color drop-down color picker. Select (Auto) to let the chart decide the color automatically.
- Set the opaqueness of the pin panel by selecting or entering a value between 0-100 in the Opaqueness box.
The lowest value 0 will make the grid lines completely transparent and invisible; and the highest value 100 will make them completely opaque.
- Click Preview view the changes made.
A Zoom Line Chart with the above configurations looks as under:
Note:
Click Apply to apply the changes made.
Click Revert to undo the changes.
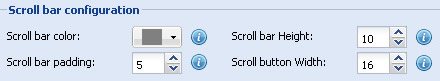
To configure the scroll bar you can:
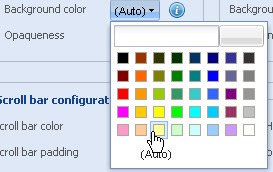
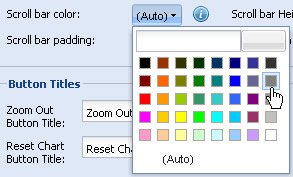
- Change the color of the scrollbar from the Scroll bar color drop-down color picker. Select (Auto) to let the chart decide the color automatically.
- Select or enter a value in the Scroll bar padding box to set the distance between the scrollbar and the main area of the chart.
- Select or enter a value in the Scroll bar height box to set the height of the scrollbar.
- Select or enter a value in the Scroll button width box to set the width of the scroll left and right scroll buttons.
- Click Preview.
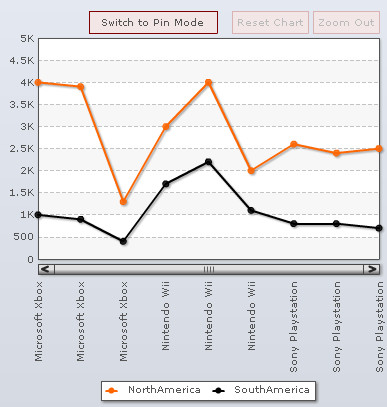
A chart with the above configurations looks as under:
Note:
Click Apply to apply the changes made.
Click Revert to undo the changes.
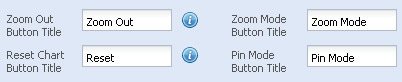
To specify custom labels for the buttons present in the chart you can:
- Enter the label in the Zoom Out Button Title text box to specify the label of the zoom out button.
- Enter the label in the Reset Chart Button Title text box to specify the label of the reset chart button.
- Enter the label in the Zoom Mode Button Title text box to specify the label of the zoom mode button.
- Enter the label in the Pin Mode Button Title text box to specify the label of the pin mode button.
- Click Preview to view the changes.
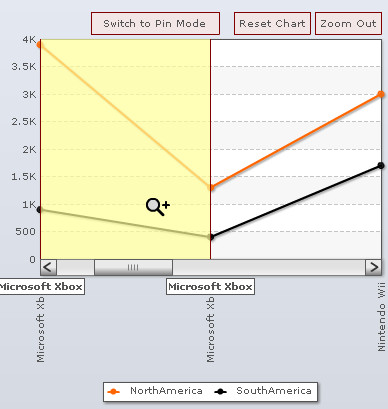
A chart with title for Pin mode: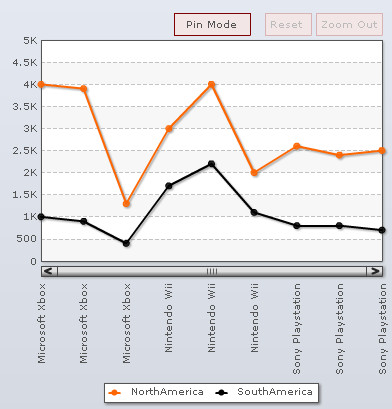
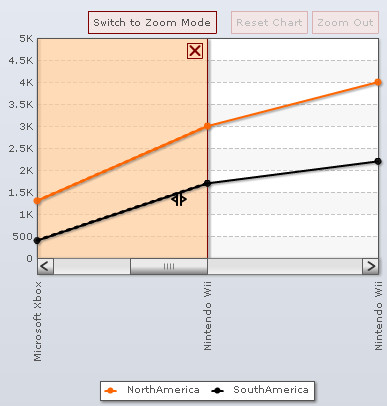
A chart with title for Zoom mode:
Note:
Click Apply to apply the changes made.
Click Revert to undo the changes.
Specify labels for the context menu items
To specify custom labels for the context menu item labels you can:
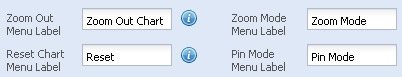
- Enter the label in the Zoom Out Menu Label text box to specify the label of the zoom out menu item.
- Enter the label in the Reset Chart Menu Label text box to specify the label of the reset chart menu item.
- Enter the label in the Zoom Mode Menu Label text box to specify the label of the zoom mode menu item.
- Enter the label in the Pin Mode Menu Label text box to specify the label of the pin mode menu item.
- Click Preview to view the changes.
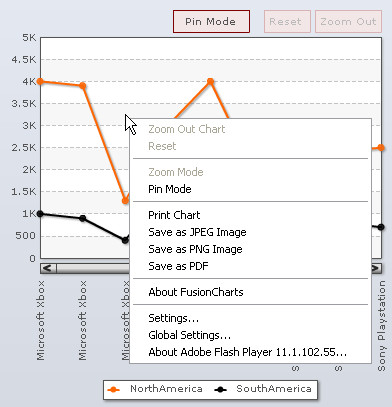
A Zoom Line Chart with the above settings looks as under:
Note:
Click Apply to apply the changes made.
Click Revert to undo the changes.
To configure the advanced settings of the zoom chart you can:
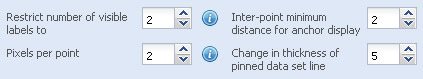
- Select or enter a value in the Restrict number of visible labels to box to set the maximum number of X-Axis labels that are to be displayed on the chart.
- Select or enter a value in the Pixels per point box to set the distance between two consecutive data points.
- Select or enter a value in the Inter-point minimum distance for anchor display box to specify the minimum distance (in pixels) between two consecutive data points that is required to show the anchors on the points.
The anchors or the marker points on a line appear only when the distance between two consecutive data points is more than the value specified through this setting.
- Select or enter a value in the Change in thickness of pinned data set line box to set the thickness of line segments present in the pin panel.
Pin panel is a rectangular panel over the chart containing a portion of the chart replicated in it. The pin panel is drag-able and is used to compare the data in the pin panel with other sections of the chart.
- Click Preview to view the changes.
A zoom line chart with the above configurations looks as under:
Note:
Click Apply to apply the changes made.
Click Revert to undo the changes.