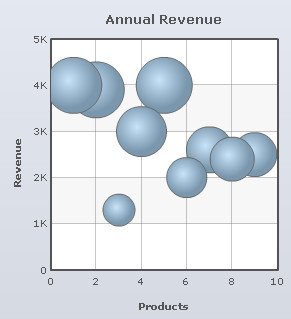
Scatter and bubble charts used to plot data for multiple numeric parameters. In these types of charts both the X and Y-axes is numeric.
Learn how to:
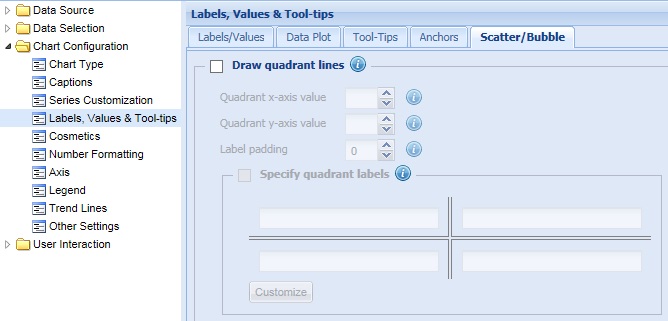
- Draw quadrant lines
- Configure position of the quadrant line on X and Y axes
- Set the space between quadrant lines and their labels
- Specify quadrant labels
- Configure quadrant line properties
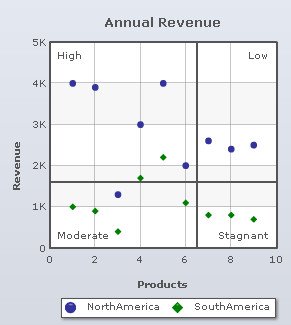
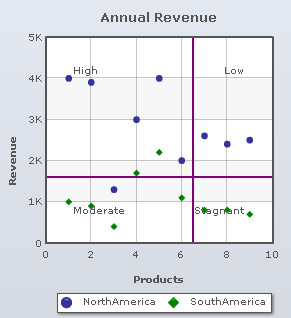
Quadrant lines divide the chart canvas into four sections by drawing a vertical and a horizontal line. By default, the intersection appears at the center of the chart.
To display the quadrant lines, select the Draw Quadrant Lines check box and click Preview to view the change.
![]()
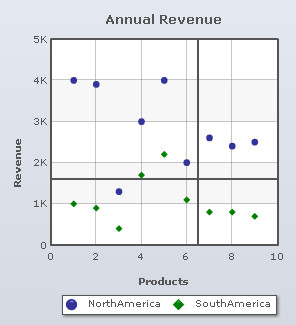
A chart showing quadrant lines looks as under:
Note:
Click Apply to apply the change made.
Click Revert to undo the change.
Configure position of the quadrant line on X and Y axes
You can also define the vertical and the horizontal position of the quadrant lines on both the X-Axis and Y-Axis.
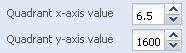
Select or enter a value in the Quadrant x-axis value box to set the vertical position of the quadrant line on the X-Axis. Click Preview to view the change.
Select or enter a value in the Quadrant y-axis value box to set the horizontal position of the quadrant line on the Y-Axis. Click Preview to view the change.
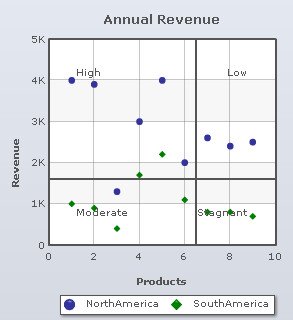
A chart with the above settings is shown below:
Note:
Click Apply to apply the changes made.
Click Revert to undo the changes.
Set the space between quadrant lines and their labels
Select or enter a value in the Label padding box to set the distance between the quadrant lines and their respective labels. The bigger the value, the closer the labels will be to the lines and vice-versa. Click Preview to view the change.
![]()
A chart with label padding value of 5 is shown below:
A chart with label padding value of 25 is shown below:
Note:
Click Apply to apply the change made.
Click Revert to undo the change.
You can specify labels for all the four quadrants on the chart.
You need to do the following:
- Select the Specify quadrant labels check box.
- Enter the intended names in the text boxes under the Specify quadrant labels section.
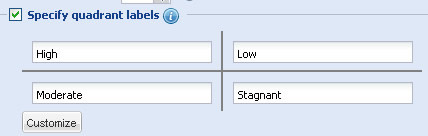
- Click Preview to view the change.
A Scatter Chart with quadrant labels looks as under:
Note:
Click Apply to apply the change made.
Click Revert to undo the change.
Configure the Quadrant line properties
To customize the appearance of the quadrant lines you can:
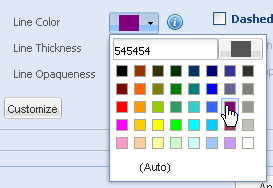
- Choose and change the color of the quadrant lines from the Line Color drop-down color picker. Select (Auto) to let the chart decide the color automatically.
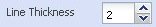
- Select or enter a value in the Line Thickness box to set the thickness of the quadrant lines.
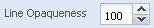
- Set the opaqueness of the quadrant lines by selecting or entering a value between 0-100 in the Line Opaqueness box.
The lowest value 0 will make the grid lines completely transparent and invisible; and the highest value 100 will make them completely opaque.
- Click Preview to view the changes.
A chart with the above configurations looks as under:
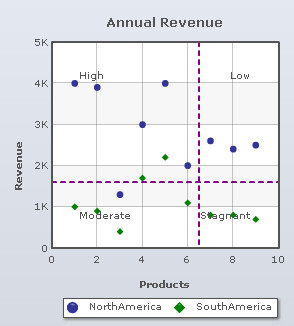
To display dashed quadrant lines, select the Dashed Line check box.
![]()
You can also configure the length of each dash and the gap between each dash forming the dashed lines. The steps are mentioned below:
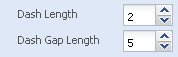
- Select or enter a value in the Dash Length box to set the length of each dash.
- Select or enter a value in the Dash Gap Length box to set the gap between each dash.
- Click Preview to view the changes.
A chart with the above settings looks as under:
Note:
Click Apply to apply the changes made.
Click Revert to undo the changes.