A radar chart is a visual interpretation of data bearing multiple dimensions. Its radial like grid structure displays the values of different categories on its axis. It is also known as Spider chart.
Learn how to:
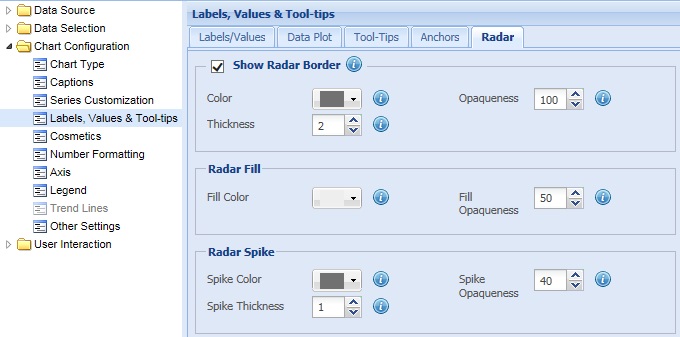
To show the radar border, select the Show Radar Border check box and click Preview to view the change. By default, the check box remains selected and the radar border is displayed.
![]()
To hide the radar border, clear the Show Radar Border check box and click Preview to view the change.
![]()
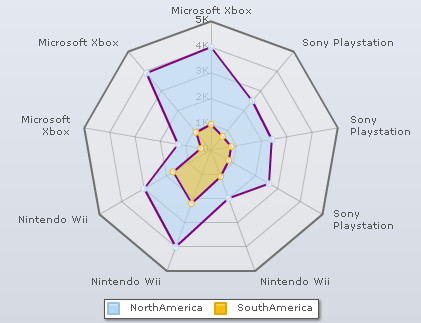
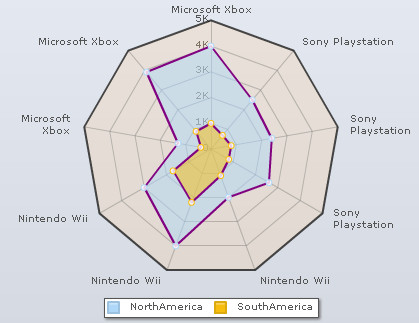
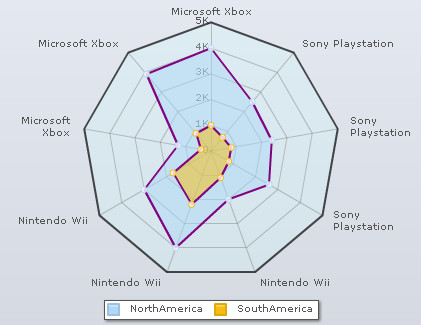
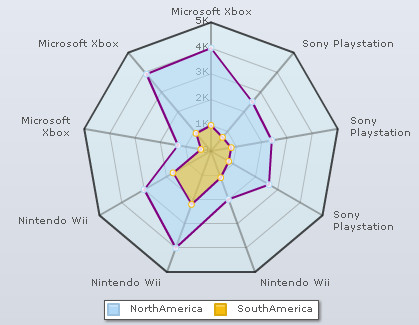
A Radar Chart showing border looks as under:
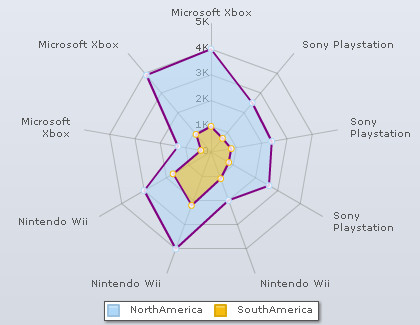
A Radar Chart without border looks as under:
To customize the radar border you can:
- Choose the color from the Color drop-down color picker to set the color of the radar border. Select (Auto) to allow the chart automatically decide the color.
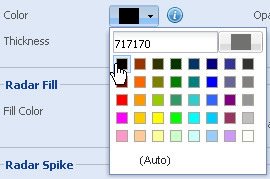
- Select or enter a value in the Thickness box to set the thickness of the radar border.
- Set the opaqueness of the radar border by selecting or entering a value between 0-100 in the Opaqueness box.
The lowest value 0 will make the grid lines completely transparent and invisible; and the highest value 100 will make them completely opaque.
- Click Preview to view the changes.
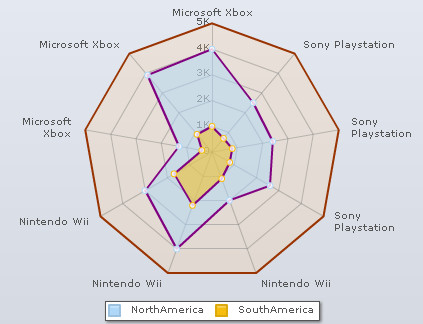
A chart with the above settings looks as under:
Note:
Click Apply to apply the changes made.
Click Revert to undo the changes.
To customize the background of the radar chart you can:
- Choose the color from the Fill Color drop-down color picker to set the color of the radar background. Select (Auto) to allow the chart to decide the color automatically.
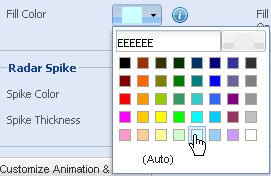
- Set the opaqueness of the radar background by selecting or entering a value between 0-100 in the Fill Opaqueness box.
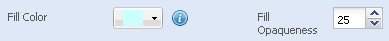
The lowest value 0 will make the grid lines completely transparent and invisible; and the highest value 100 will make them completely opaque.
- Click Preview to view the changes.
A chart with the above configurations is looks as under:
Note:
Click Apply to apply the changes made.
Click Revert to undo the changes.
To customize the radar spikes you can:
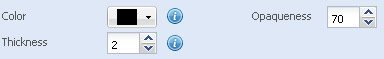
- Choose the color from the Spike Color drop-down color picker to set the color of the radar spikes. Select (Auto) to allow the chart automatically decide the color.
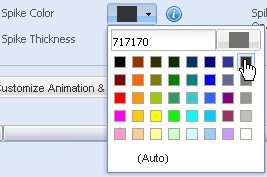
- Select or enter a value in the Spike Thickness box to set the thickness of the radar spikes.
- Set the opaqueness of the radar spikes by selecting or entering a value between 0-100 in the Spike Opaqueness box.
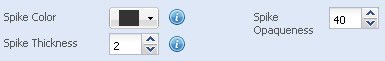
The lowest value 0 will make the grid lines completely transparent and invisible; and the highest value 100 will make them completely opaque.
- Click Preview to view the changes.
A chart with the above configurations looks as under:
Note:
Click Apply to apply the changes made.
Click Revert to undo the changes.