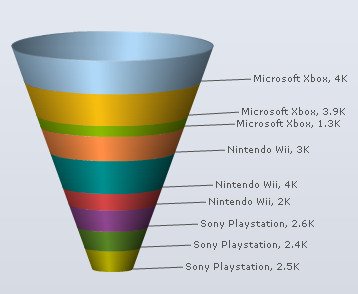
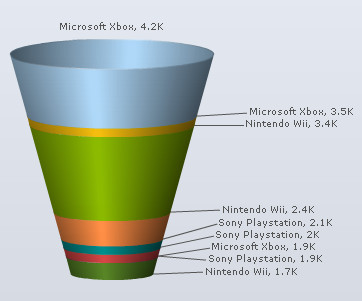
The funnel chart helps in showing the outcome of a process that involves reduction or elimination at each progressive level. The recruitment process is an ideal example of such a process as it involves elimination at each progressive level.
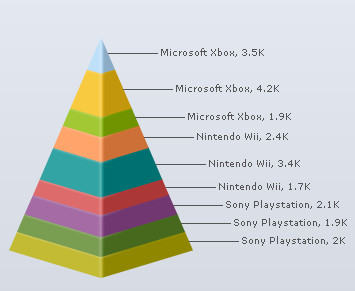
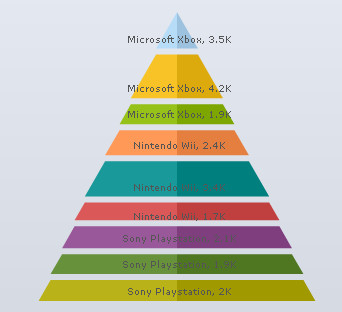
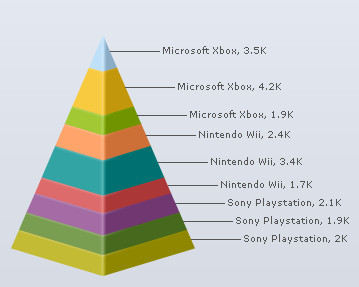
A pyramid chart consists of various segments. Each segment represents a set of data and has its individual visual properties so that they can be distinguished from one another. Pyramid chart are mainly used for comparison data.
Learn how to:
- Customize the common visual aspects of Funnel and Pyramid charts
- Show streamlined data (dependent on previous value)
- Display hollow funnels
- How to set the Y-Scale perspective 3D angle in Funnel charts and Pyramid charts
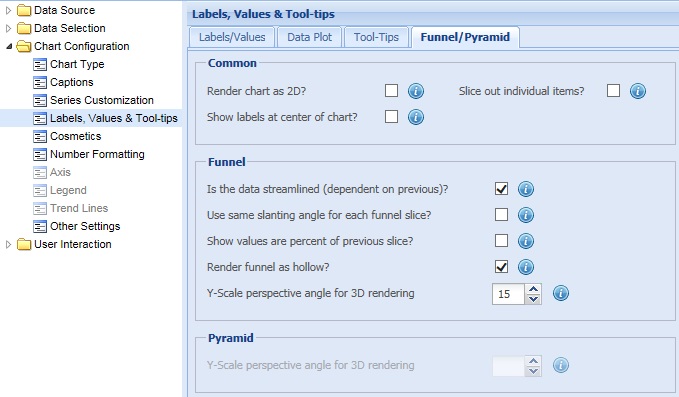
Customize the common visual aspects of Funnel and Pyramid charts
To customize the visual appearance of a Funnel or Pyramid chart you can:
- Select the Render chart as 2D? check box to render the chart in two-dimensional view.
- Select the Show labels at the center of chart? check box to display the data labels at the center of the dataplots.
For Pyramid charts, this setting is applicable only when the charts are rendered as 2D.
- Select Slice out individual items? check box to slice out all individual funnels or pyramids after the chart completes rendering.
- Click Preview to view the changes.
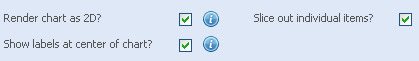
A chart with the above settings is shown below:
Note:
Click Apply to apply the changes made.
Click Revert to undo the changes.
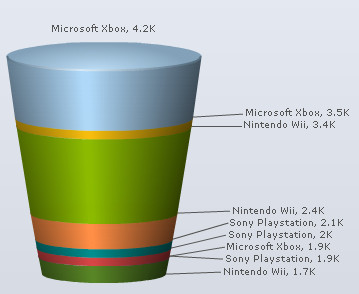
Show streamlined data (dependent on previous value)
To display ordered data select the Is the data streamlined (dependent on previous)? check box and click Preview to view the change. When this setting is checked, each funnel slice is dependent on the previous funnel slice value.
By default, this check box is selected.
Note: This setting is applicable only for Funnel charts.
![]()
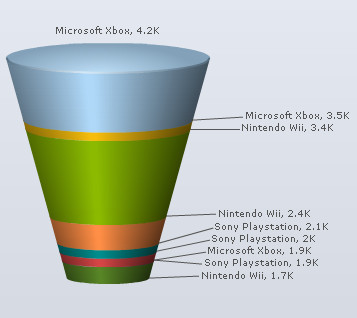
To display each funnel with the same slanting angle, select the Use same slanting angle for each funnel? check box and click Preview to view the change.
This setting is applicable only to funnel chart and only when the Is the data streamlined check box is checked.
![]()
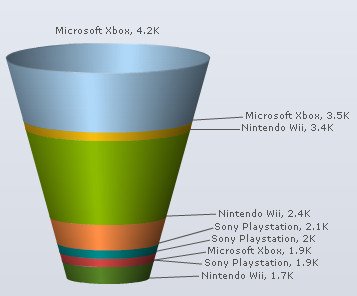
To calculate and show percentage values for each funnel with respect to the previous funnel, select the Show values are percent of previous slice? check box and click Preview to view the change.
When this setting is turned on then the percentage value shown at the top is always 100%.
This setting is applicable only to funnel chart and only when the Is the data streamlined setting is checked.
![]()
Note:
Click Apply to apply the changes made.
Click Revert to undo the changes.
To render the funnels as hollow, select the Render funnel as hollow? check box and click Preview to view the change. By default, the check box remains selected and the funnels are displayed as hollow funnels.
![]()
To display solid funnels instead of hollow funnels, clear the Render funnel as hollow? check box and click Preview to view the change.
Note:
Click Apply to apply the changes made.
Click Revert to undo the changes.
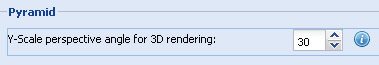
How to set the Y-Scale perspective 3D angle in Funnel and Pyramid charts
Select or enter a value in the Y-Scale perspective angle for 3D rendering box to set the 3D perspective of the chart or the angle from which the chart is viewed. This setting is applicable only in 3D view. Click Preview to view the change.
![]()
For Pyramid charts, select or enter the value in the Y-Scale perspective angle for 3D rendering under Pyramid section and click Preview to view the change.
Note:
Click Apply to apply the changes made.
Click Revert to undo the changes.