Collabion Charts for SharePoint offers a Scatter (X-Y chart) and a Bubble (X-Y-Z chart) chart. Scatter and Bubble charts are used for plotting data that can be defined in terms of multiple numeric parameters.
In these charts, both X-Axis and Y-Axis scales are numeric. Therefore, the position of a data point is an indicator of two distinct numeric values.
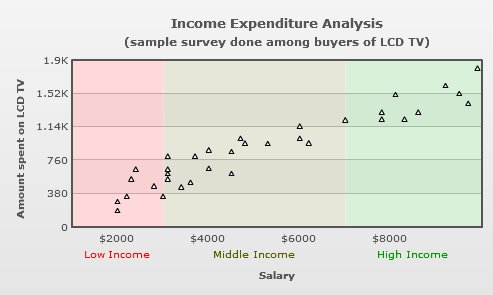
The Scatter chart is used for plotting data that is defined in terms of two numeric parameters, X and Y. A data point allows the comparison of an entity in terms of its relative positions with respect to each numeric axis. An example of scatter chart is shown in the image below:
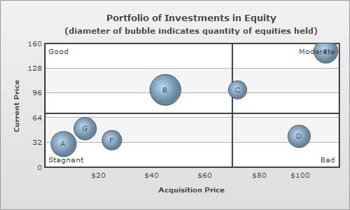
The Bubble chart is used for plotting data, which is defined in terms of three numeric parameters, X, Y and Z. The data points in a Bubble chart behave in the same way as in a Scatter chart. Additionally, the third parameter (Z) is indicated by the size or area of each bubble. An example of Bubble chart is shown in the image below: