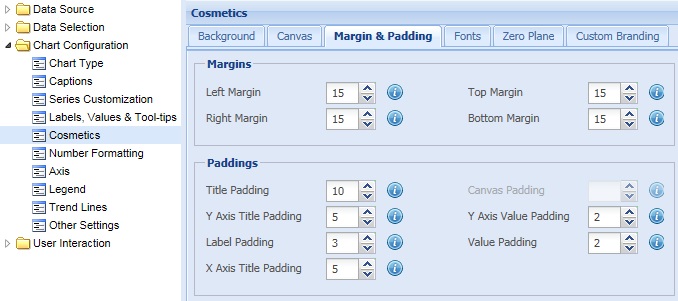
Chart margin refers to the space between the entire chart border and the border of the chart canvas (main chart area where the data is plotted).
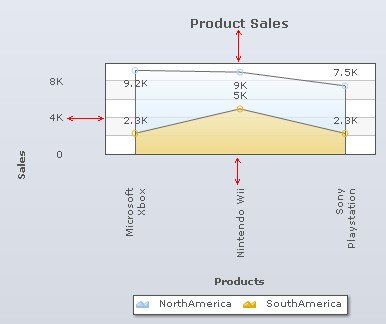
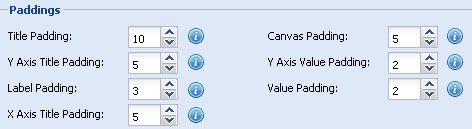
Padding refers to space between a particular chart element and its immediate neighboring element. Given below is a chart showing chart paddings:
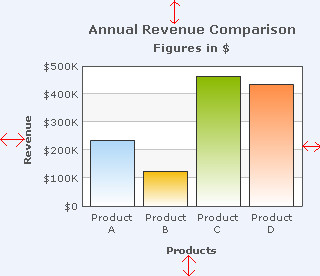
Given below is a chart showing chart margins:
A chart showing canvas padding
Learn how to:
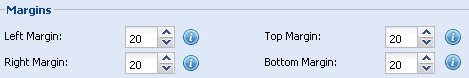
Configure the margins of the chart
To configure the margins of the chart you can:
- Select or enter a value in the Left Margin box to set the space between the left chart border and the left canvas border.
- Select or enter a value in the Right Margin box to set the space between the right chart border and the right canvas border.
- Select or enter a value in the Top Margin box to set the space between the top chart border and the top canvas border.
- Select or enter a value in the Bottom Margin box to set the space between the bottom chart border and the bottom canvas border.
- Click Preview to view the changes.
A chart with the above settings looks as under:
Note:
Click Apply to apply the changes made.
Click Revert to undo the changes.
Specify the padding of the chart elements
To specify the space between chart elements and their immediate neighboring object you can:
- Select or enter a value in the Title Padding box to set the distance between the sub-caption and the top canvas border.
- Select or enter a value in the Y Axis Title Padding box to set the horizontal distance between the Y-Axis title and the Y-Axis values.
- Select or enter a value in the Label Padding box to set the distance between the X-Axis labels and the bottom canvas border.
- Select or enter a value in the X Axis Title Padding box to set the vertical distance between the X-Axis title and the X-Axis values.
- Select or enter the a value in the Canvas Padding box to set the amount of empty space on the left and the right section inside the chart canvas. This setting is applicable only to line and area charts.
- Select or enter a value in the Y Axis Value Padding box to set the distance between the Y-Axis values and the left canvas border.
- Select or enter a value in the Value Padding box to set the distance between the data values and the dataplots inside the chart canvas.
- Click Preview to view the changes.
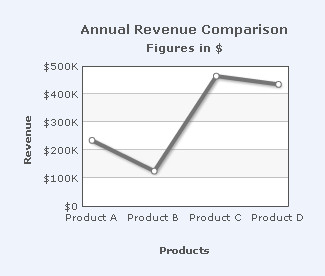
A chart with the above configurations looks as under:
Note:
Click Apply to apply the changes made.
Click Revert to undo the changes.