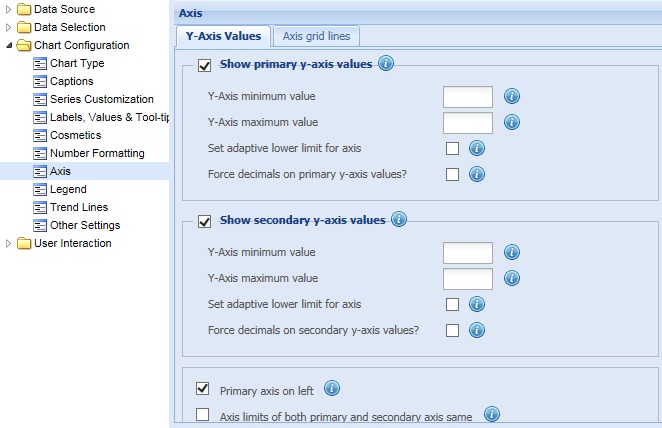
Collabion Charts for SharePoint enables you to customize the scale for both the primary Y-Axis and secondary Y-Axis.
Learn how to:
- Show or hide the primary Y-Axis values
- Customize the primary Y-Axis scale
- Show or hide the secondary Y-Axis values
- Customize the secondary Y-Axis scale
- Change the position of the primary Y-Axis
- Specify similar axis limits for both primary and secondary Y-Axes
- Customize font style of the Y-Axis values
Show or hide the primary Y-Axis values
To display the primary Y-Axis values, select the Show primary y-axis values check box and click Preview to view the change. By default, the check box is selected and the primary Y-Axis values are displayed.
![]()
To hide the values of the primary Y-Axis, clear the Show primary y-axis values check box. Click Preview to view the change. If this check box is cleared, the related fields become deactivated.
![]()
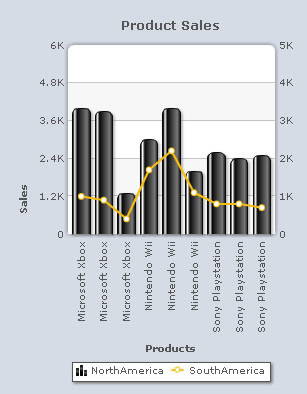
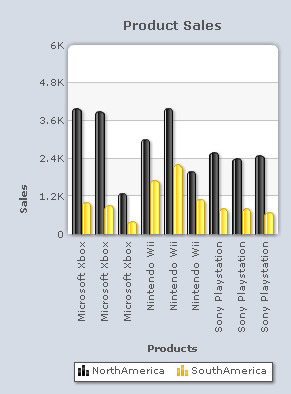
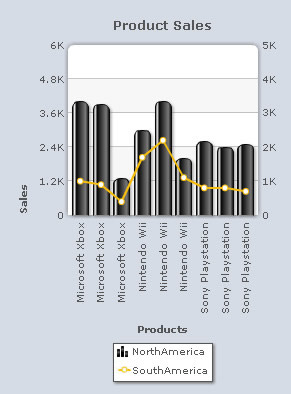
A chart with the primary Y-Axis values looks as under:
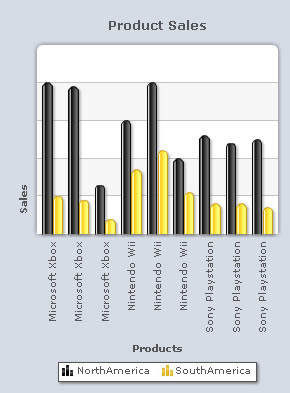
A chart with the primary Y-Axis values hidden looks as under:
Note:
Click Apply to apply the change.
Click Revert to undo the change made.
Customize the primary Y-Axis scale
Collabion Charts for SharePoint allows you to customize the primary Y-Axis scale.
Learn more about:
- Setting minimum and maximum values for primary Y-Axis
- Setting adaptive lower limit for primary Y-Axis
- How to set decimal places on primary Y-Axis values
Setting minimum and maximum values for primary Y-Axis
You can specify the minimum and maximum values for the primary Y-Axis. By default, the minimum value for the primary Y-Axis is zero while the maximum value is automatically calculated by the chart, based on the data provided.
You can do the following:
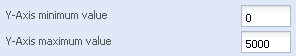
- In the Y-Axis minimum value text box, enter the appropriate value to specify the minimum value for the primary Y-Axis.
- In the Y-Axis maximum value text box, enter the appropriate value to specify the maximum value for the primary Y-Axis.

- Click Preview to view the changes made.
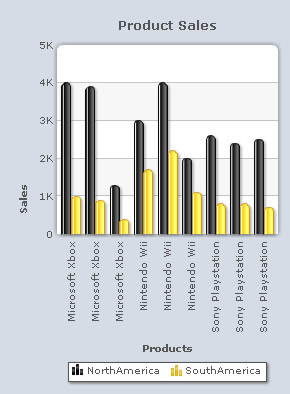
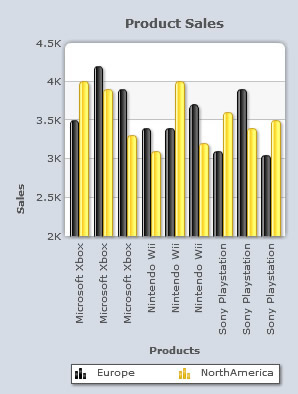
A chart displaying the minimum and maximum primary Y-Axis values looks as under:
Note:
Click Apply to apply the changes.
Click Revert to undo the changes made.
Setting adaptive lower limit for primary Y-Axis
Collabion Charts for SharePoint enables the automatic calculation of the minimum value of the primary Y-Axis. Select the Set adaptive lower limit for axis check box and click Preview to view the change. The minimum value is calculated by the chart based on the available data and is displayed in place of the default minimum value ‘0’.
Note: You can set an adaptive lower limit for the Y-Axis only when the minimum value is not specified. In case the minimum value for Y-Axis is specified, the chart will display that value, even if the Set adaptive lower limit for axis check box is selected.
![]()
A chart with adaptive lower limit for primary axis is shown below:
Note:
Click Apply to apply the change.
Click Revert to undo the change made.
How to set decimal places on primary Y-Axis values
Collabion Charts for SharePoint allows the charts to display data with an exact number of decimal places after the whole number. For this, you need to select the Force decimals on primary y-axis values? check box. Click Preview to view the change. For example, 10.831 will appear as 10.8310 if you set this field to 4.
![]()
Note: The number of decimal places is set using the Round numbers to how many decimals and Round axis values to how many decimals settings present in the Number Formatting section.
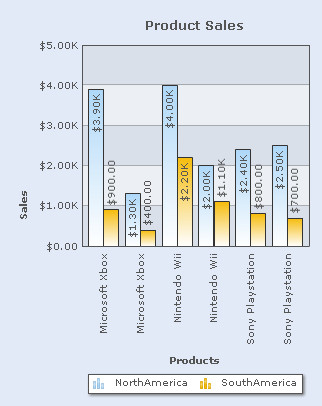
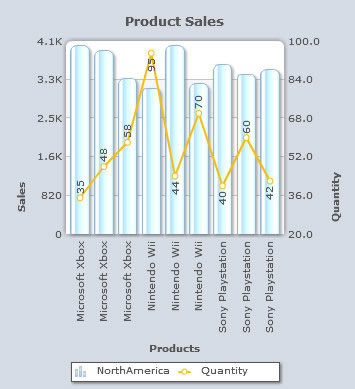
A chart with formatted decimal places of the primary Y-Axis values is shown below:
Note:
Click Apply to apply the change.
Click Revert to undo the change made.
Show or hide the secondary Y-Axis
Secondary Y-Axis appears only in combination dual Y-Axis charts. By default, it appears on the right side of the chart.
To display the secondary Y-Axis values, select the Show secondary y-axis values check box and click Preview changes to view the change.
![]()
To hide the values of the secondary Y-Axis, clear the Show secondary y-axis values check box and click Preview to view the change. If this check box is cleared, the related fields become deactivated.
![]()
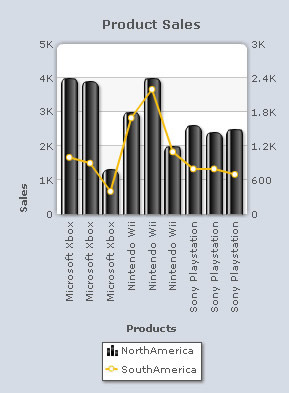
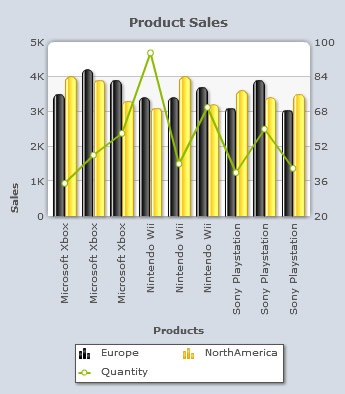
A chart showing the secondary Y-Axis values looks as under:
Note:
Click Apply to apply the change.
Click Revert to undo the change made.
Customize the secondary Y-Axis scale
Collabion Charts for SharePoint allows customization of the secondary Y-Axis scale.
Learn more about:
- Setting minimum and maximum values for secondary Y-Axis
- Setting adaptive lower limit for secondary Y-Axis
- How to set decimal places on secondary Y-Axis values
Setting minimum and maximum values for secondary Y-Axis
You can specify the minimum and maximum values for the secondary Y-axis. By default, the minimum value for the secondary Y-Axis is zero and the maximum value is automatically calculated by the chart, based on the data provided.
You can do the following:
- In the Y-Axis minimum value text box, enter the appropriate value to specify the minimum value for the secondary Y-Axis.
- In the Y-Axis maximum value text box, enter the appropriate value to specify the maximum value for the secondary Y-Axis.
- Click Preview to view the changes made.
A chart displaying the minimum and maximum secondary Y-Axis values looks as under:
Note:
Click Apply to apply the changes.
Click Revert to undo the changes made.
Setting adaptive lower limit for secondary Y-Axis
Collabion Charts for SharePoint enables the automatic calculation of the minimum value of the secondary Y-Axis. For this, you need to select the Set adaptive lower limit for axis check box. Click Preview to view the change. The minimum value is calculated by the chart based on the available data and is displayed in place of the default minimum value ‘0’.
Note: You can set an adaptive lower limit for the Y-Axis only when the minimum value is not specified. In case the minimum value for Y-Axis is specified, the chart will display that value, even if the Set adaptive lower limit for axis check box is selected.
![]()
A chart with adaptive lower limit for secondary axis is shown below:
Note:
Click Apply to apply the change.
Click Revert to undo the change made.
How to set decimal places on secondary Y-Axis values
Collabion Charts for SharePoint allows the charts to display data with an exact number of decimal places after the whole number. You need to select the Force decimals on secondary y-axis values? check box and click Preview to view the change. For example, 10.831 will appear as 10.8310 if you set this field to 4.
![]()
Note: Set the values of the secondary Y-Axis scale to show an exact number of decimal places, with trailing zeroes. The number of decimal places is set using the Round off to how many decimals setting present in the Number Formatting section.
A chart with formatted decimal places of the secondary Y-Axis values is shown below:
Note:
Click Apply to apply the change made.
Click Revert to undo the change.
Change the position of the primary Y-Axis
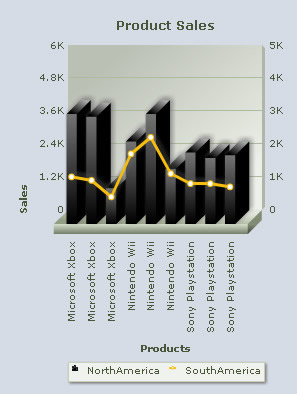
By default, the primary Y-Axis appears on the left side of the chart and the secondary Y-Axis appears on the right side. You can interchange the position of the primary and secondary Y-Axes.
Note: This feature is applicable to 3D Combination Dual Y-Axis charts only.
By default, the Primary axis on left check box is selected.
![]()
A chart with the primary Y-Axis on left is shown below:
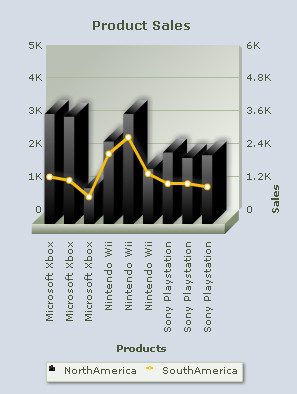
To interchange the position of the Y-Axes clear the Primary axis on left check box and click Preview to view the change.
![]()
A chart with the primary Y-Axis on the right side is shown below:
To set the axes back to their default positions, select the Primary axis on left check box and click Preview to view the change.
Note:
Click Apply to apply the changes.
Click Revert to undo the changes made.
Specify similar axis limits for both primary and secondary Y-Axes
You can determine similar scale for both primary and secondary Y-Axes.
Select the Axis limits of both primary and secondary axis same check box to determine the same maximum and minimum scale limits for both the primary and secondary Y-Axes. Click Preview to view the change.
![]()
A chart showing same axis limits looks as under:
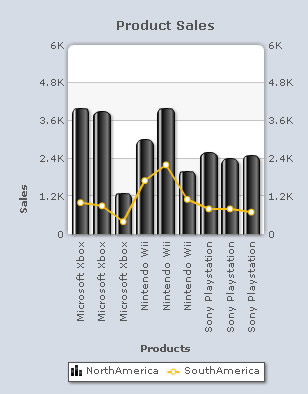
To specify different scales for primary Y-Axis and secondary Y-Axis, clear the Axis limits of both primary and secondary axis same check box and click Preview to view the change.
![]()
A chart with different axis limits is shown below:
Note:
Click Apply to apply the changes.
Click Revert to undo the changes made.
Customize font style of the Y-Axis values
You can change the font of the Y-Axis values. Click the Customize button at the bottom. The Customize Font dialog box opens. You can create new font style. To know more, visit: how to change the font style.