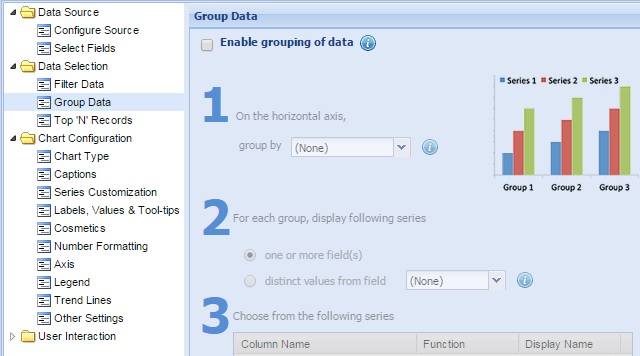
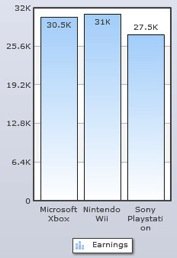
You can optionally summarize and put together a bunch of data values in groups using various grouping options. For example, in a data displaying the total earnings in three years for three products – XBOX, Playstation and Nintendo, you want to aggregate sales data across all 3 years for these 3 products.
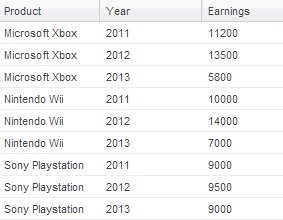
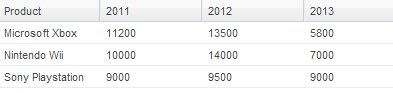
The initial data will look as under:
To do this, we follow the steps below:
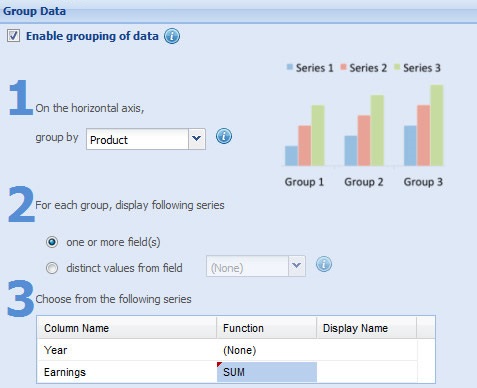
- Select Enabling grouping of data check box.
- Select Product from the drop down list beside On the horizontal axis, group by.
- Select one or more field(s) radio button. This enables you to group one or more columns.
- Select SUM grouping function beside the Earnings column name.
- This setting provides the name of the grouping or aggregate function. The available grouping functions are:
- SUM: Provides the total of all the values under a group.
- AVERAGE: Provides the average of all the values under a group.
- COUNT: Provides the count of all the values under a group.
- MIN: Provides the lowest of all the values under a group.
- MAX: Provides the highest of all the values under a group.
- SUM: Provides the total of all the values under a group.
- Click Apply.
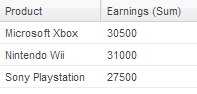
The grouped data will look as under:
The chart will look as under:
You can further summarize data values using a specific part of any date like year, quarter, month, day, hour, minute or second. For example, you can summarize daily sales figures into year-wise sales data.
Moreover, you can create multiple data columns from the distinct values present in a single column.
Further, learn how to:
How to split data from a single column into multiple columns
You can create multiple data columns from the distinct values present in a single column. For example, in the given data, suppose you want to view the earnings of three different years. But year cannot be a series since different years are not individual columns in your data, but different values in a single column. Here you can split the Year column and display the total earnings of each product in three different years.
The initial data will look as under:
The grouped data for the chart will look as under:
To achieve split data, you need to:
- Select Product from the drop down list beside On the horizontal axis, group by.
- Select the distinct values from field radio button and choose Year in the drop down list as the data series name.
- Select SUM function from the drop-down list under For each series, display option.
- Select Earnings series name from the drop-down list under For each series, display option.
The data after using split by would look something as under:
The chart will look as under:
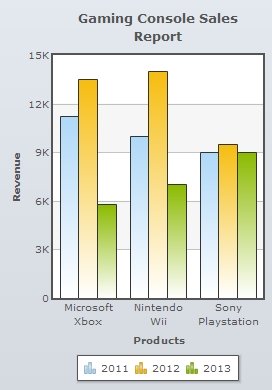
In the above chart, please note that each individual year is considered as a data series.
Note: This setting works in combination with Group By option.
To summarize data using a specific part of any date like year, quarter, month, day, hour, minute or second, follow the steps below:
- Select a column having Date/Time values beside On the horizontal axis, group by.
- Select a part of date or time from the drop-down list beside where dates are grouped by the. The available options are Year, Half Year, Month, Day, Hour, Minute and Second.
- Select a summarizing function (SUM, AVERAGE, COUNT, MIN or MAX) and apply to the columns provided in the table below Choose from the following series.