Anchors are marker points on a line, spline or area chart. The anchors help to identify the data point better on the chart. Anchors also display tool-tips showing the details of the data points when the mouse is hovered over them.
Learn how to:
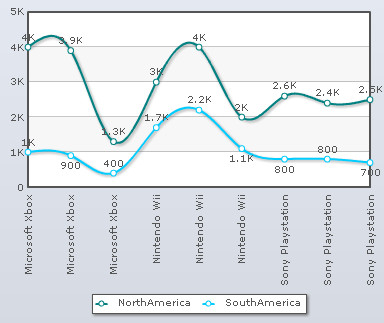
To display anchors or marker points on a line/spline/area chart select the Show Anchors check box and click Preview to view the change. By default, the check box is selected and the anchors are displayed.
![]()
A Line Chart displaying anchors is shown below:
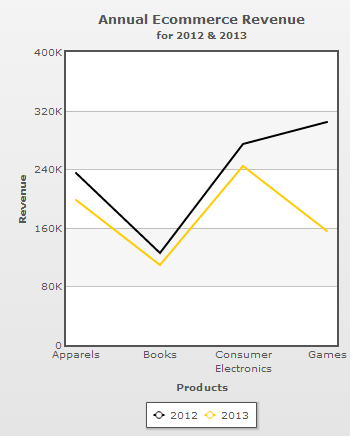
To hide the anchors clear the Show Anchors check box and click Preview to view the change.
![]()
A chart without anchors looks as under:
Note:
Click Apply to apply the change made.
Click Revert to undo the change.
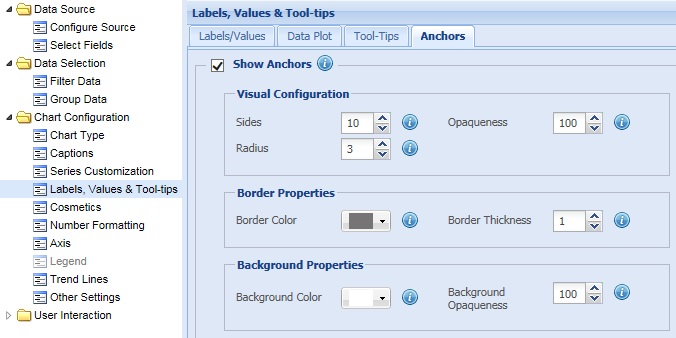
Collabion Charts for SharePoint allows you to configure the radius, transparency and the number of sides of an anchor. Furthermore, you can also customize the appearance of the anchors by customizing the border and background properties of the anchors.
Learn more about:
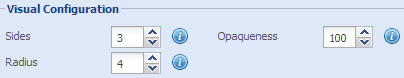
In order to configure the radius, number of sides and the transparency of the anchors you can:
- Select or enter a value in the Sides box to determine the shape of the anchors. For example, if the value were set to 3 the anchors would be displayed as triangle. By default, the anchors are displayed as circles.
- Select or enter a value in the Radius box to determine the size of the anchors.
- Set the opaqueness of the anchors by selecting or entering a value between 0-100 in the Opaqueness box.
The lowest value 0 will make the grid lines completely transparent and invisible; and the highest value 100 will make them completely opaque.
- Click Preview to view the changes.
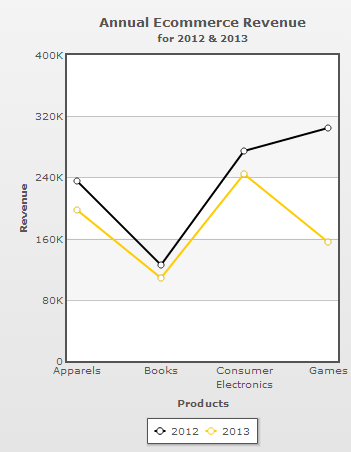
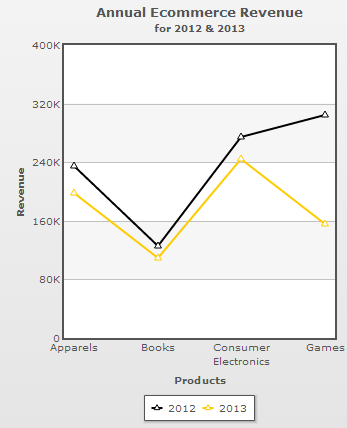
A chart with the above configurations set for the anchors looks as under:
Note:
Click Apply to apply the changes made.
Click Revert to undo the changes.
How to customize the appearance of the anchors
To customize the appearance of the anchors you can:
- Choose and change the color in the Border Color drop-down color picker to set the color of the anchor border. Select (Auto) to let the chart decide the color automatically.
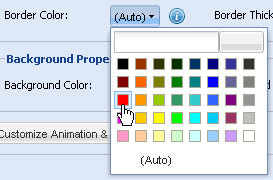
- Select or enter a value in the Border Thickness box to specify the thickness of the anchor border.
- Choose and change the color in the Background Color drop-down color picker to set the background color of the anchor. Select (Auto) to let the chart decide the color automatically.
- Select or enter a value between 0-100 in the Background Alpha box to specify the transparency of the anchor background.
The value 100 makes the anchor background completely opaque, whereas, the value 0 makes the anchor background completely transparent.
![]()
- Click Preview to view the changes.
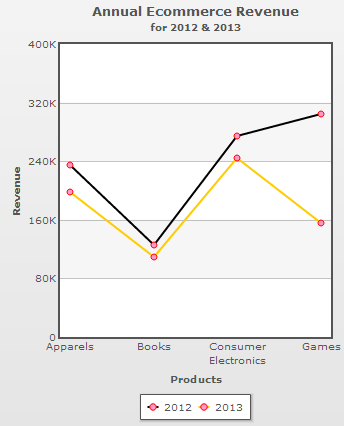
A chart with the above configurations looks as under:
Note:
Click Apply to apply the changes made.
Click Revert to undo the changes.