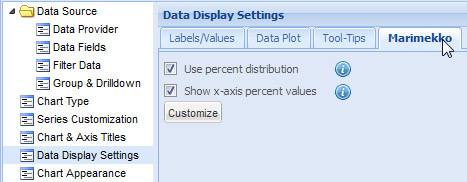
Marimekko charts are mainly stacked column charts with columns of variable width. They are mainly used for marketing analysis.
Learn how to:
- Use percent distribution
- Show or hide the X-Axis percent values
- Customize the animation and style effects of the Marimekko chart
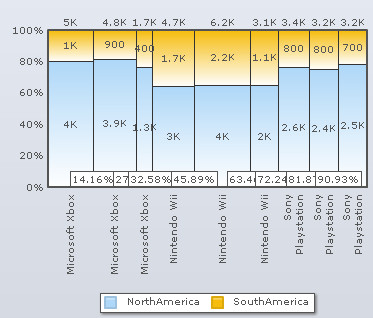
To display the percentage share of each data value of a column, select the Use percent distribution check box and click Preview to view the changes. The total of a column is considered as 100% when this setting is applied.
By default, this check box is selected.
![]()
To display actual data values of the columns instead of percentage shares, clear the Use percent distribution check box and click Preview to view the changes.
![]()
A Marimekko chart with percent values:
A Marimekko chart with actual values: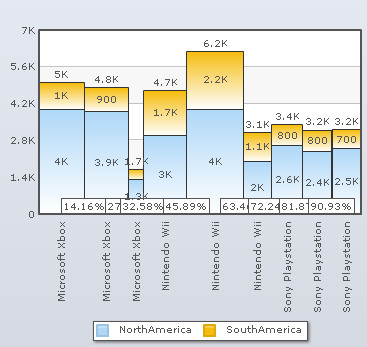
Note:
Click Apply to apply the change made.
Click Revert to undo the change.
Show or hide the X-Axis percent values
To display the cumulative share (in percentage) of each column on the X-Axis, select the Show x-axis percent values check box and click Preview to view the change. The cumulative share of the last column, which is 100%, is not shown.
By default, this check box is selected.
![]()
To hide the cumulative share (in percentage) from the X-Axis clear the Show x-axis percent values check box and click Preview to view the changes.
![]()
A Marimekko chart with x-axis percent values:
A Marimekko chart without x-axis percent values: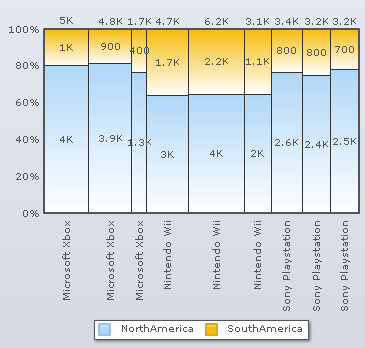
Note:
Click Apply to apply the change made.
Click Revert to undo the change.
Customize the animation and style effects of the Marimekko chart
You can add styles and effects to the X-Axis percent values. Click the Customize button that will open the Customize Styles dialog box that allows you to do the following: