Collabion Charts for SharePoint Online
Collabion Charts for SharePoint Online is a free, code-less solution for creating stunning and insightful charts in SharePoint
It is very easy to use and enables you to create beautiful charts from SharePoint lists in less than 5 simple steps

No need to write code, just click and build!
Ultimate ease of use - being a completely wizard based solution, it is 100% code-less! You can create beautiful and informative charts with less than 5 mouse clicks.

Get data from all your lists and views
Easy 2 step connection and data sourcing from all your SharePoint Lists and Views - it will even source data from your views with grouped or filtered content

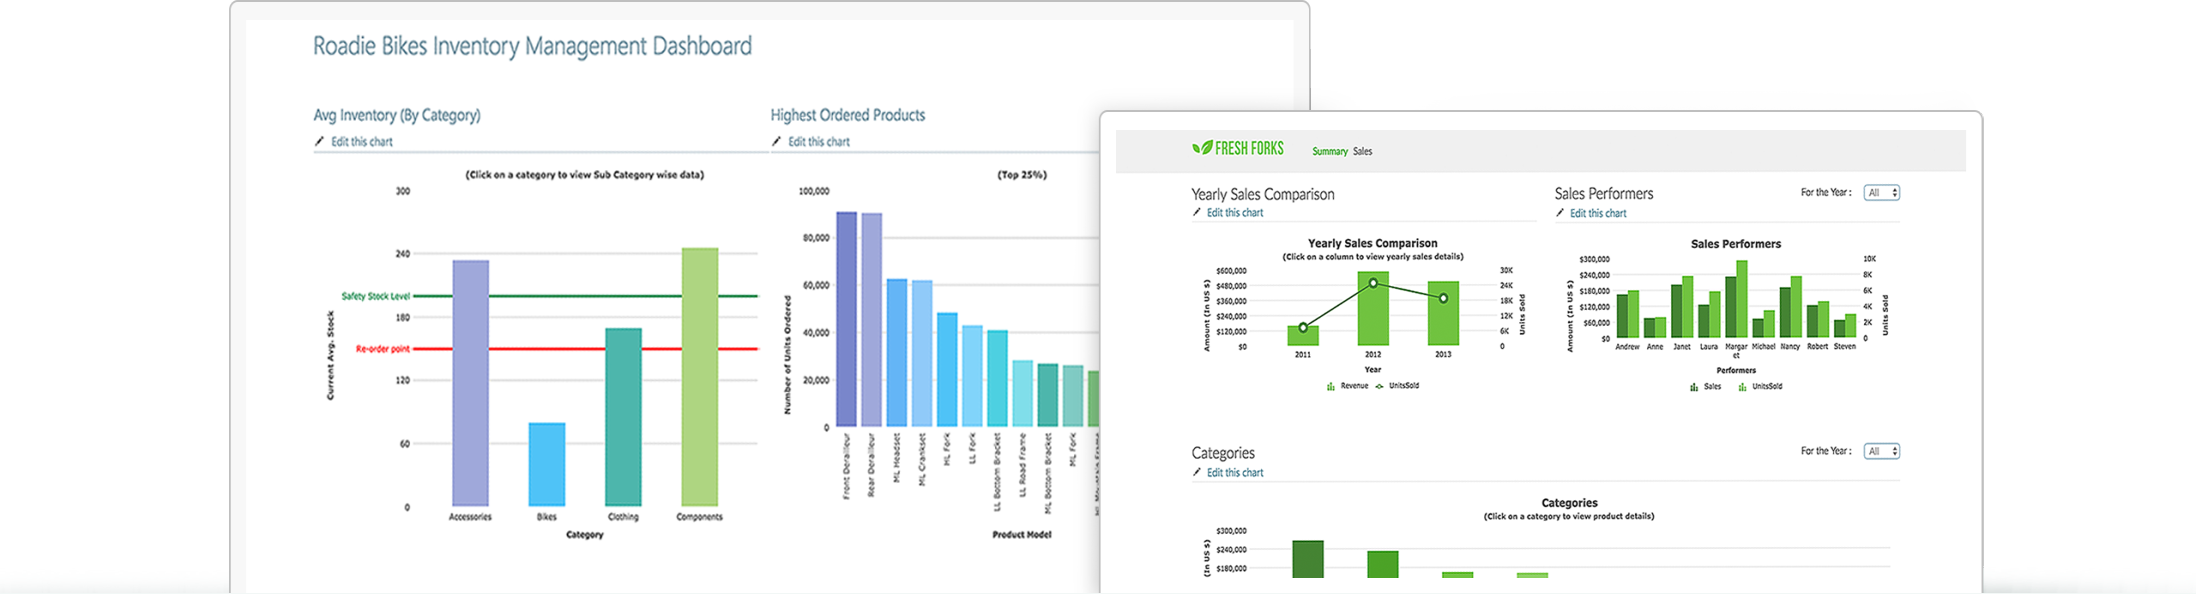
Use different charts for different scenarios
An extensive chart gallery with more than 25 different chart types to choose from including state of the art 3D charts adding delight to data analysis.

Customize your charts the way you want
Completely customizable chart, labels and number formats - you can customize your chart and axis titles, customize the numbers on your charts or even select between Regular and European number formats!


Empower your charts to consume data better
Power features like Dual Y-Axis, multiple plot types(line, area, column) to get that extra insight into your multi-series charts by plotting each series differently

Make your charts appealing with beautiful colors
Beautiful pre-configured themes for your charts to make them visually more appealing - with 4 different themes you have the option to choose the color which best suits your environment.

So, what are you waiting for? Get it now for your SharePoint Online environment!